


The last two years were extremely difficult for the service industry—and not just because of the pandemic. While COVID-19 certainly played a role in exacerbating the issues, workforce labor shortages, complicated equipment, and increasingly reactive service were also challenges faced by many service providers.
And yet, according to the data analyzed in Aquant’s Service Intelligence Benchmark Report, there is another overarching theme to be found: the way organizations provide service today is not in tune with customer expectations. Six million tickets later, the report reveals some key observations about service performance from the customer’s perspective.
Our report measures data across:
- 76 organizations, including service divisions within OEMs and third-party service organizations across manufacturing, medical devices, capital equipment, HVAC, commercial appliances, and more
- More than 6 million work orders
- More than 31,000 technicians
- $7 billion total in service costs
- An average of 3 years of service data per company
We analyzed:
- How service organizations and their workforce measure up against industry benchmarks
- Why hitting your KPIs rarely equates to outstanding customer experiences
- Why a missed First Time Fix (FTF) event leads to a spiraling negative impact
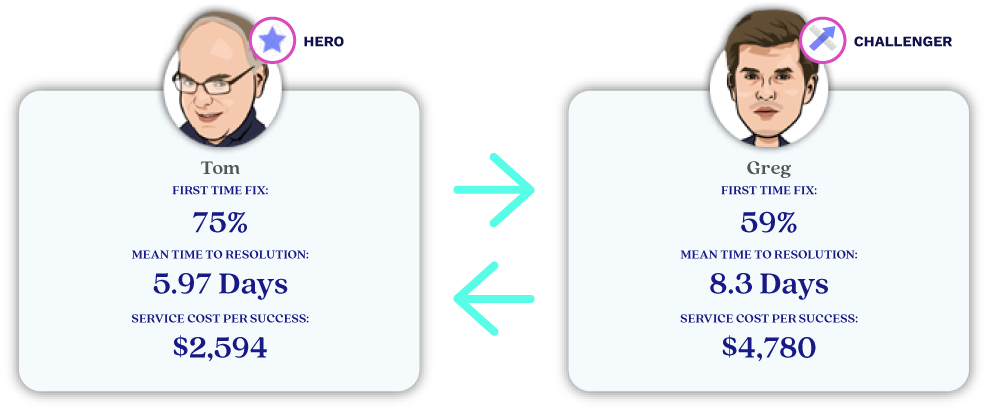
- How a workforce shortage has exacerbated the existing skills gap between the heroes (highest performers) and challengers (lowest performers) within each organization
Here’s what we discovered:
- Service organizations suffer from a wide customer experience (CX) gap. First Time Fix (FTF) rates are one of the biggest contributors to CX gaps, or the difference between what customers expect and what your organization delivers. Our analysis shows that companies who measure FTF rates in 7-day or 14-day windows have artificially inflated FTF rates, and are setting the stage for a wide experience gap. That’s the perfect setup for frustrating customer experiences. The moral of the story: a few metrics can’t provide the entire picture—and it’s time to look at experience as a whole.
- The knowledge gap between heroes and challenges is becoming more expensive. In 2021, service organizations faced even larger hiring challenges than in the past. This has left the industry with tens of thousands of unfilled jobs, and caused service costs to increase.
- The bottom quarter of the workforce costs organizations 84% more than the top quarter. That’s 4% higher than last year.
- The top 20% of the workforce (service heroes) has a 75% FTF rate.
- The bottom 20% of the workforce (service challengers) has a FTF rate of 59%.
- It’s possible to overcome these challenges. Your data tells a bigger story—if you know what to look for. Looking beyond your KPIs will help you tailor service for every customer, provide a better CX, upskill your team, and cut costs.
So, what’s next?
It’s time to understand your business on a much deeper level than ever before. Download Aquant’s Field Service Benchmark Report to see how you stack up to your peers, uncover the stories that your KPI averages are telling, and start seeing your service from the customer’s perspective.

Recent Posts
-

-

-
AI and Shift Left Will Propel Success in Medical Device Service, Says New Aquant Report
Read More »March 05, 2024 Janice Camacho


