


KPI tracking and data collection are crucial components of field service management. But relying too heavily on any one KPI (even First Time Fix Rate!) as a measure of success creates blindspots for service leaders.
Looking at a single KPI could result in you missing other vital indicators. Most service organizations cannot measure how the workforce skills gap impacts First Time Fix (FTF) Rates. In turn, they can’t gauge how a low FTF Rate drives up service costs and negatively impacts customer satisfaction.
Instead of relying on hunches about service performance, Aquant went to the source—data from more than 16.2 million work orders—to compile the 2023 Field Service Benchmark Report.
The following key takeaways illuminate why service leaders must look beyond FTF Rate to gain insights into their organization’s performance—and how tools like Service Co-Pilot can help organizations improve critical metrics in one platform.
FTF Rate isn’t the best way to measure service success.
To gain an accurate snapshot of service performance and costs, leaders must look beyond typical stats like FTF Rate—especially if they seek predictive maintenance data. FTF Rates have remained stagnant for all but a handful of top-performing companies—and with traditional field management software, FTF Rates have not improved.
Additionally, FTF Rates should never be measured in isolation. On average, a failed first visit leads to:
- 2.75 additional visits, impacting FTF Rate
- 13 extra days spent resolving the issue, increasing Resolution Time
What is the cost of FTF Rate failure?
From a cost and customer perspective, failure rates can be disastrous. Beyond the KPIs, service leaders need to factor in labor costs for additional truck rolls, extra parts costs, machine downtime, customer dissatisfaction, and all the other jobs that aren’t being resolved if technicians focus on repeat visits for every one in four jobs.
Tip: Does your organization have a way to track critical KPIs and measure changes over time? Service Insights, a part of the Aquant Co-Pilot suite, helps leaders see all KPIs at a glance, automatically calculate changes in metrics, provide predictive maintenance, examine technician performance, and more.
FTF Rate cannot measure customer sentiment.
That’s especially true if organizations don’t measure FTF Rates in at least 30-day windows.
Trying to understand customer satisfaction by relying primarily on FTF Rates creates a customer experience gap. That’s the difference between what customers expect and what your organization delivers.
Our analysis shows that companies measuring FTF Rates in 7-day or 14-day windows set the stage for a broad experience gap, leading to frustrating customer experiences. Measuring FTF Rates in less than 30-day windows misses many repeat visits related to the exact root cause. Your records may show that an asset was serviced twice within a month, and both of those visits were successfully fixed on the first visit. Your customer likely disagrees.
Your FTF Rate reporting may be creating service blindspots.
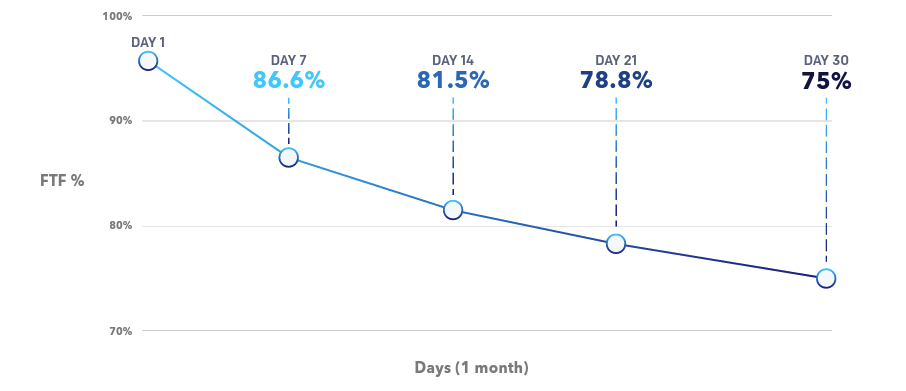
The way you measure FTF Rates impacts your field service report. Instead of defining FTF Rates in arbitrary increments (7 days, 14 days, or 21 days), consider the natural service cycle. Our research shows that measuring in 30-day windows strips out false-positive FTF Rates.
As evidenced by the example above:
- If your FTF Rate is similar when measured at 7 and 30 days, you have a small gap.
- If your FTF Rate has a wide variation (usually a high rate at 7 days and a low rate at 30 days), you have a large gap. In such cases, your team is likely focused on hitting their numbers instead of great customer experiences.
Tip: According to our analysis, top organizations have bridged their skills gap and improved First Time Fix Rates by upskilling the workforce. Check out Aquant’s 2023 Field Service Benchmark Report for step-by-step recommendations.
The knowledge gap is increasing service costs. Shift your service strategy left to combat the effects.
In 2023, service organizations faced even more considerable hiring challenges than in the past. This has left the industry with tens of thousands of unfilled jobs and caused service costs to increase.
- The bottom 20% of the workforce (service challengers) costs organizations 67% more than the top quarter.
- The top 20% of the workforce (service heroes) has an 80% FTF Rate. The bottom 20% of the workforce (service challengers) has a 61% FTF Rate.
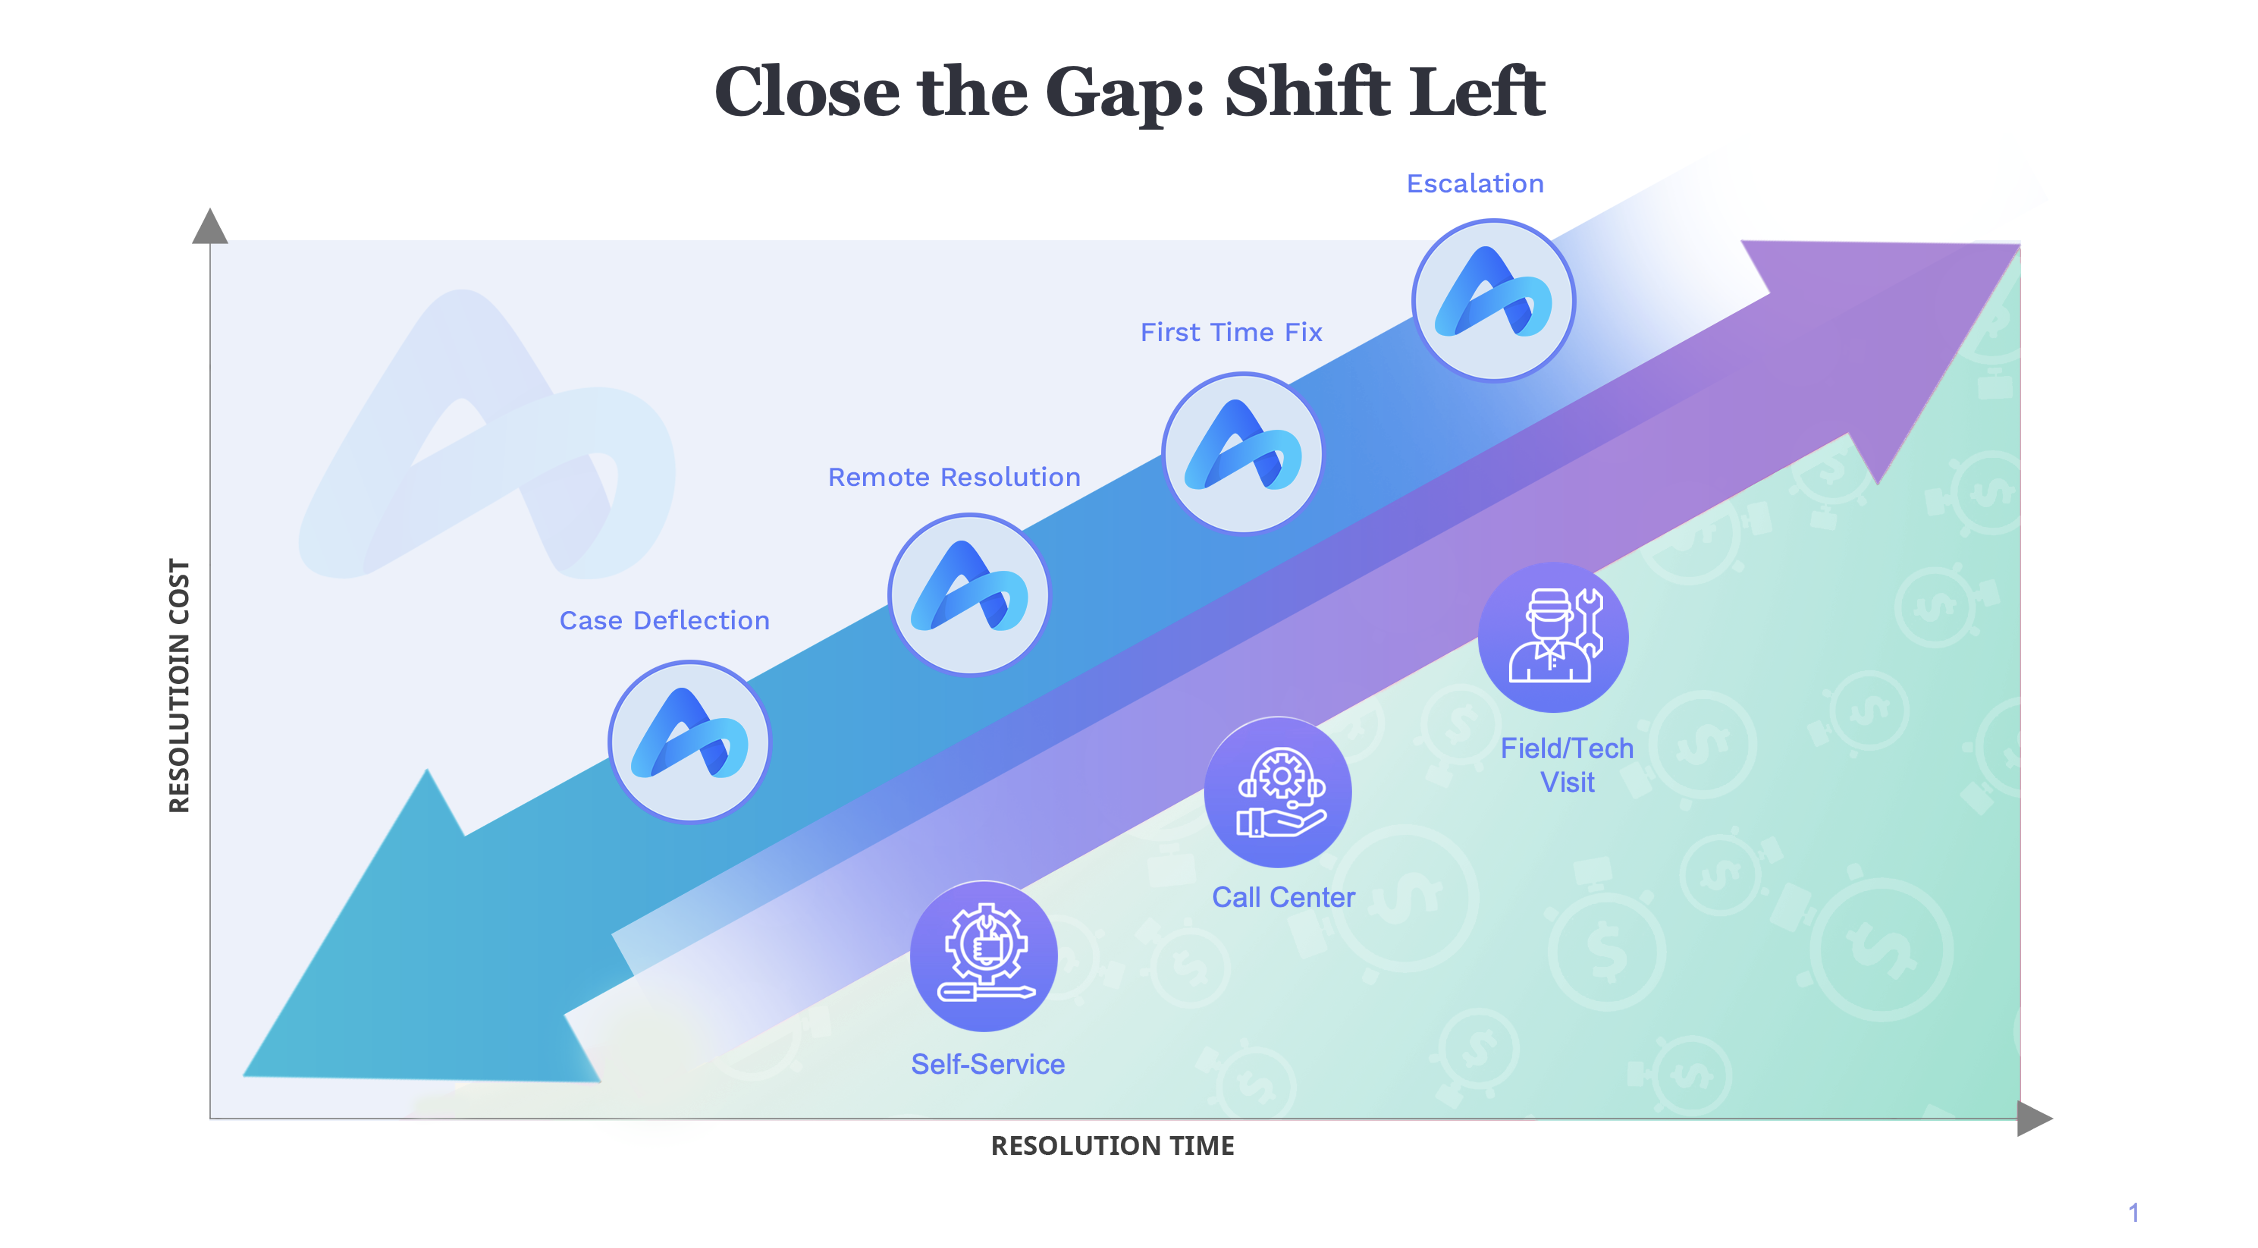
Tip: Shift your organization left to break the typical service cycle that results in higher costs and customer escalations. Measuring, interpreting, and using your data wisely can help move service closer to your customer—reducing escalations, improving FTF Rates, identifying truck rolls that could’ve been resolved remotely, or even turning simple calls into a self-service experience.
Get solutions to improve customer service and boost your First Time Fix Rate.
If you want to improve the customer experience, honing in on top metrics like First Time Fix Rate is a great place to start. And Aquant’s latest natural language processing product, Service Co-Pilot, can help—especially because it delivers generative AI purpose-built for service.
Service Co-Pilot identifies the best solution to any service-related issue, improves customer experiences by resolving cases faster and more efficiently, and minimizes costs simultaneously. This means anyone using the tool can get the correct solution on the first go—avoiding extraneous dispatch.
How does it work? Service Co-Pilot’s technology merges the best in artificial and human intelligence. It generates recommendations based on intel found in an organization’s historical service data and the minds and notes of subject matter experts. And because Service Co-Pilot is trained using information sourced directly from an organization’s past work and talent, it provides tailored, applicable, and helpful solutions for any present-day service challenges. This helps any user—from customers and contact center agents to technicians and service leaders—resolve issues with the speed and accuracy of their team’s best expert. Plus, it automates data analysis using artificial intelligence.
Learn how Service Co-Pilot will help your team boost First Time Fix Rates and improve customer experiences—and do so in a matter of weeks.
Recent Posts
-

-
AI and Shift Left Will Propel Success in Medical Device Service, Says New Aquant Report
Read More »March 05, 2024 Janice Camacho -

The Power of AI in Service Management: A Journey Towards Boosting Efficiency and Customer Satisfaction
Read More »February 20, 2024 Courtney Stafford


